Our Methodology
How we acquired and parsed the electoral data
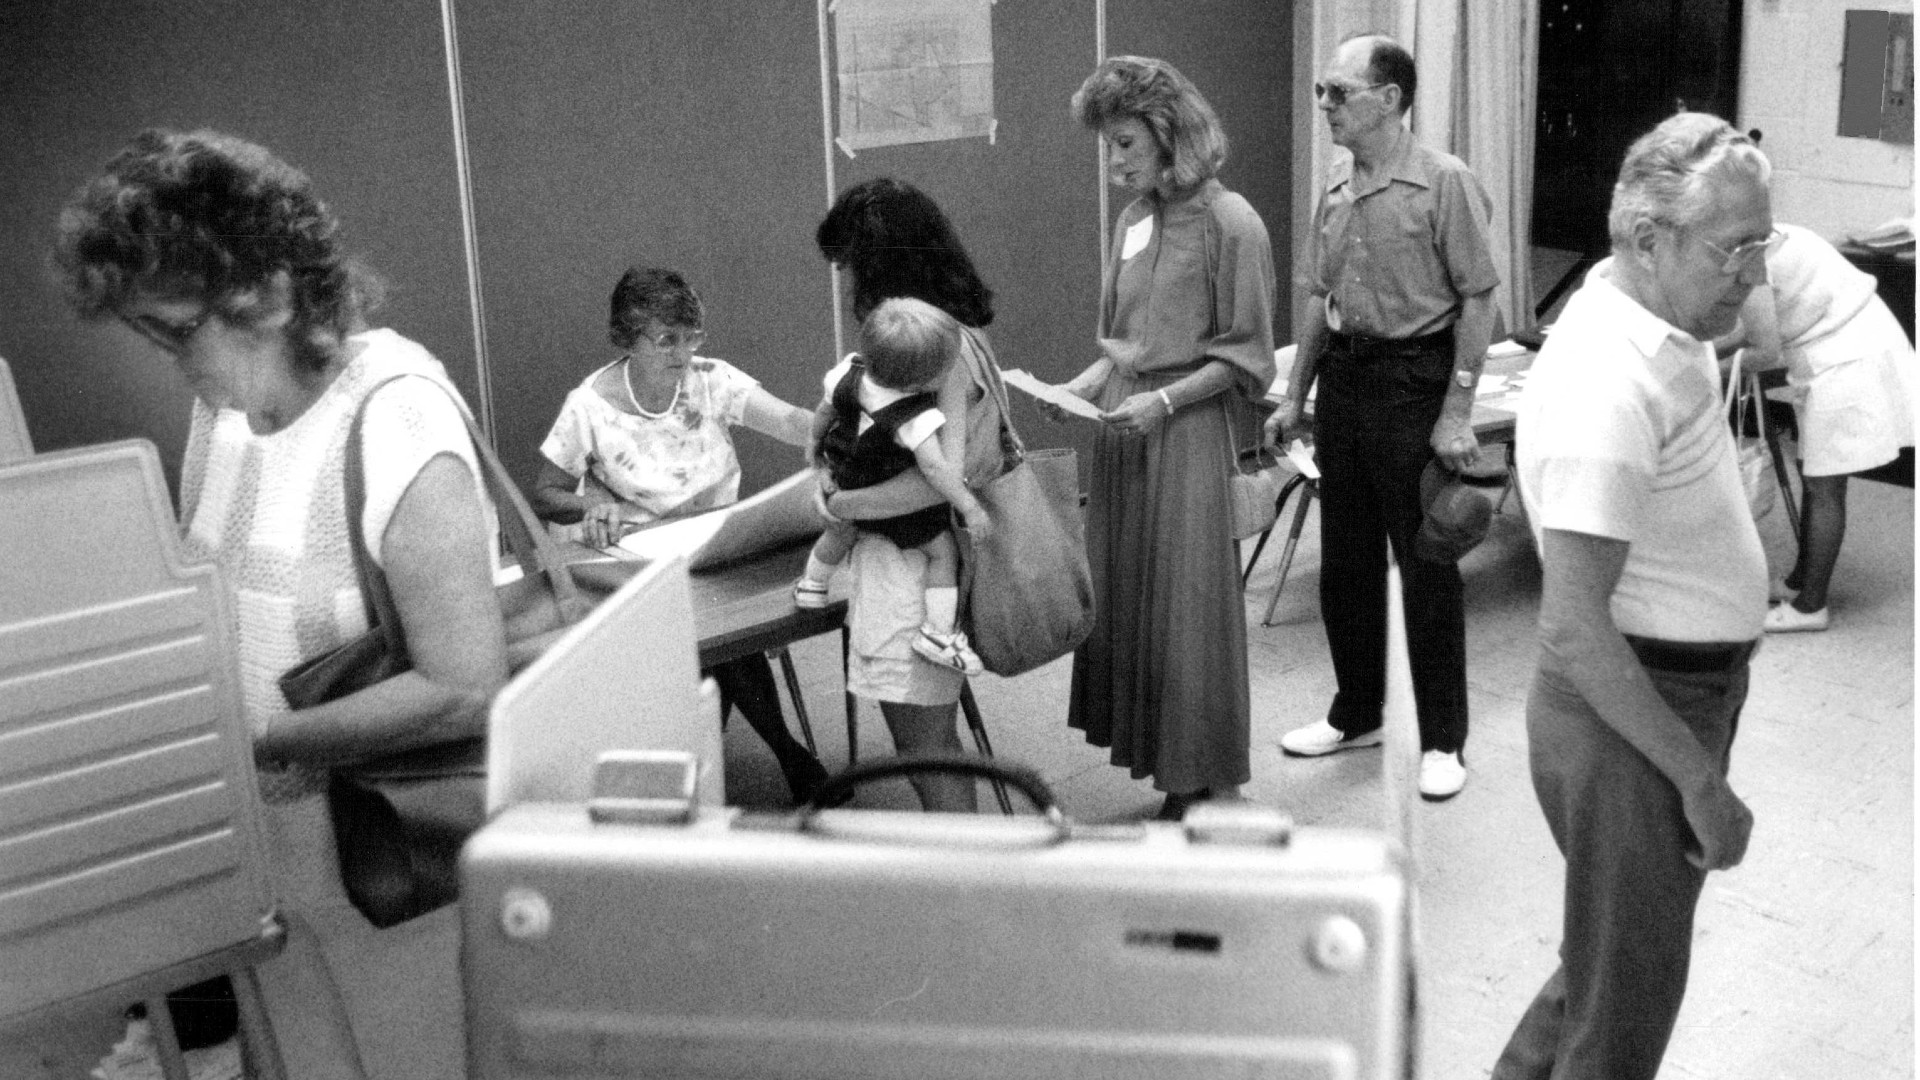
Because the United States has a secret ballot, it’s impossible to know the exact breakdown of votes between women and men and how each group voted. Marie Claire relied on exit polls for this data, the best approximation available. It’s important to note that “best available” does not mean “foolproof.” Exit polls have become more accurate over time with better sampling and weighting, but even as of 2016 they tended to overrepresent college-educated white voters and underrepresent working-class voters.
Before 1984, exit polls were administered and calculated only at the national level, not state by state. But because electoral votes apportioned at the state level (rather than the national popular vote) are what decides U.S. presidential elections, state exit polls were essential in determining whether elections might have turned if only men (or only women, or only white women) had voted. (The relatively much smaller gender gaps prior to 1980 make it very unlikely that earlier elections would have had different outcomes under the different voting scenarios.)
The Roper Center for Public Opinion Research at Cornell University archives exit-poll data. For 1984, 1988, 2000, 2004, and 2016, we got our data directly from Roper. (Easy-to-read cross tabs, which are a type of query showing relationships between two or more survey variables, weren’t available for 1984 and 1988, so we had Roper convert the data for us.) Data for 1992, 1996, and 2008 came from CNN; 2012 data came from NBC. (CNN and NBC are members of the same exit-poll consortium, along with CBS and ABC—all archived at Roper.)
In addition to the exit-poll data, we used the UC Santa Barbara archive The American Presidency Project to record how many electoral votes each state was allotted, and which candidate got the electoral votes, in each election. We compared the exit-poll data with these actual results to determine which states would flip in our counterfactual scenarios. Tallying the flipped results, we reverse-calculated the electoral-vote counts for each scenario in each election to determine the likely alternative-history “winner.”
We strove to analyze how the intersection of race and gender determined elections. Due to low sample sizes of minority populations in many states, there is insufficient information to tell with statistical significance how specific demographic groups like Black women voted in those states. But we do have comprehensive data on how white women voted from 1992 onward, as well as how women voted as a whole. It is a fact that white women vote more conservatively than women as a whole and that electoral-vote counts for white women are more Republican than the actual electoral-vote results for every election since at least 1992. From that, we can deduce that non-white women have been integral in swaying elections toward the Left.
Another important note: Exit polls were not administered on the state level for 23 states in 2016, 20 states in 2012, 27 states in 1988, and 34 states in 1984. For the most part, the states that haven’t had individual exit polls are so red or blue that exit polls would almost certainly not have shown a different result for our various scenarios; we can generally assume men and women (and white women) all voted along the same party lines. There are two instances where that may not be the case. In 2012, no statewide exit poll was conducted for Texas. In 2016, women voted 49 percent for Clinton and 47 percent for Trump, so it’s worth considering whether they would have voted Democrat in 2012. But the vote spread between Romney and Obama was 16 points in 2012 (as opposed to a nine-point spread in 2016), so that likely would not have flipped in our women-only scenario. Another instance that gives more pause is Georgia in 2012, when there was an eight-point spread between Romney and Obama, and so, conceivably, the women-only vote could have gone Democrat, like it did in 2016.
Washington, D.C., which gets three electoral votes, is counted as a state.
Get exclusive access to fashion and beauty trends, hot-off-the-press celebrity news, and more.
“Turnout of Eligible Women Voters by Race from 2008–2016”
Data from Mark Lopez, the director of global migration and demography at Pew Research Center. Source: Pew Research Center tabulations from the U.S. Census Bureau’s 2008, 2012, and 2016 Current Population Survey, November Voting and Registration Supplement.
We used the numbers for women of mutually exclusive demographic groups, which were “non-Hispanic Black alone,” “non-Hispanic white alone,” “Hispanic (of any race),” “non-Hispanic Asian alone,” and “non-Hispanic mixed race.” And then as a basis for comparison, we showed the percent of all U.S. eligible voters total and all U.S. eligible women voters.
“Share of the Two-Party Vote by Gender from 1920–1936” and “Share of the Two-Party Vote by Gender from 1948–1972”
Data from political scientist Kevin Corder. For the earlier graph, we used Corder’s original research based on ecological inference, the process of drawing conclusions about individual-level behavior from aggregate-level data. (For more information, read the illuminating book he coauthored with Christina Wolbrecht, A Century of Votes for Women: American Elections Since Suffrage.) For the 1948–1972 graph, Corder compiled the data from the American National Election Studies (ANES).
In both of these graphs, it’s important to note that these are the shares of the two-party vote; third parties are not taken into account. The percentages of Republicans and Democrats by gender are therefore slightly inflated from what they actually were.
“Percent of People Who Voted Republican from 1976–2016”
The reason for the large drop in 1992 is the presence of H. Ross Perot, who captured 21 percent of men’s votes and 17 percent of women’s. Men and women each voted 38 percent Republican, and 41 percent and 45 percent Democrat respectively.
This data, as well as the data for “Turnout by Gender from 1976–2016,” comes from Roper’s “How Groups Voted.”
“The Demographic Breakdown of Voters in 2016”
Using a vertical cross tab for national exit-poll data from Roper, the percentages of all demographic groups add up to 99 percent due to rounding. In the exit poll, “white,” “Black,” and “Latino” are broken out by gender, but “all other races” is not. To get the approximation for “women of all other races,” we added up the percentages for white, Black, and Latino women, then subtracted that from the percentage listed for total women.
“The Makeup of Hillary Clinton’s Voters in 2016”
The methodology here is the same. The total percentage of Clinton’s votes broken down by gender and race adds up to 101 percent. And when calculating the “women of all other races” and “men of all other races,” you get 4 percent and 3 percent respectively, and the total of “all other races” is 8 percent, so again there is naturally a little error.
2016 Electoral Scenarios
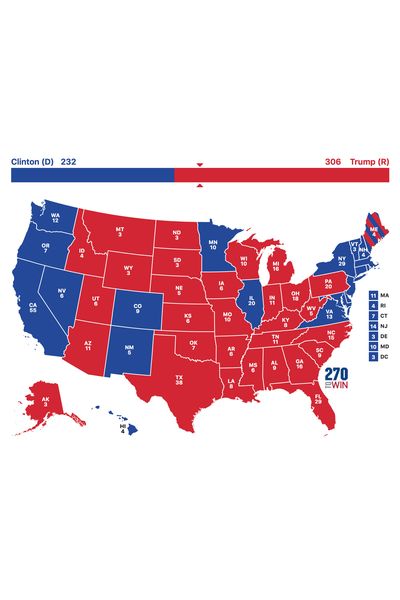
The Actual Vote
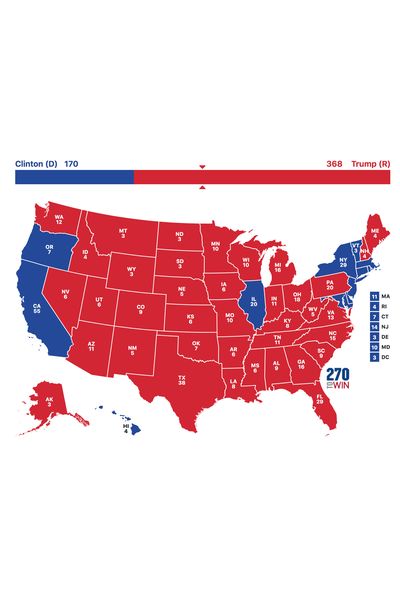
If Only Men Voted
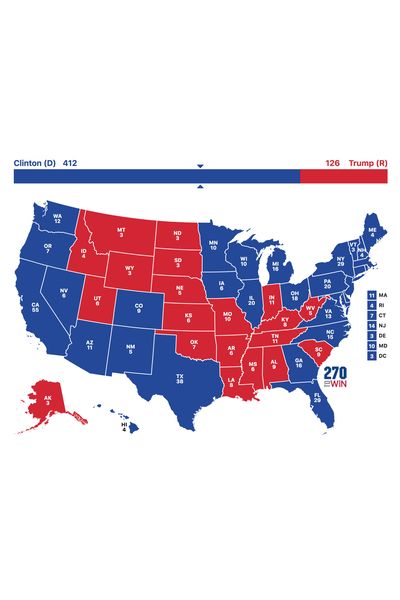
If Only Women Voted
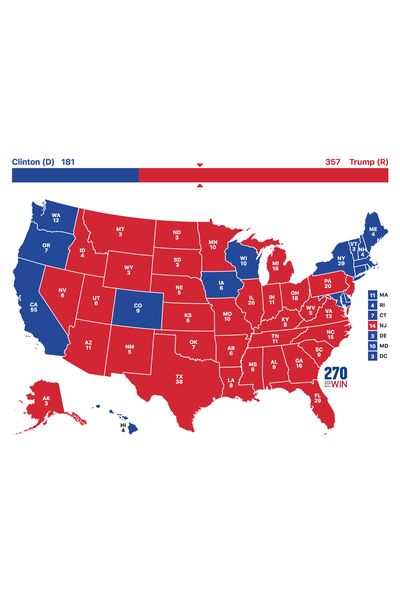
If Only White Women Voted
2016 results
In 2016, a nearly unprecedented total of seven electors did not vote for the candidate who won their state: In Washington (which went to Clinton), three electors voted for Colin Powell and one for Faith Spotted Eagle; in Texas (which went to Trump), one elector voted for Ron Paul and another for John Kasich; in Hawaii (which went to Clinton), one elector voted for Bernie Sanders. We chose to use the tallies of pledged electors for the “actual vote” Electoral College total for this year.
For 2016, 28 states had individual statewide exit polls. There were no state-level exit polls for AK, AL, AR, CT, DC, DE, HI, ID, KS, LA, MA, MD, MS, MT, ND, NE, OK, RI, SD, TN, VT, WV, and WY.
Maine is one of two states where the electoral votes are not winner-take-all (meaning whoever receives the majority of votes in the state gets all the state’s electoral votes). Nebraska is the other exception to winner-take-all, but there was no individual statewide exit poll for Nebraska for 2016. Out of Maine’s four electoral votes, the overall winner gets two electoral votes, and for the other two electoral votes, one goes to the winner in Maine’s Congressional District 1 (CD1) and the other goes to the winner of Maine’s CD2. We don’t have the exit-poll data divided by districts, so we don’t know the male/female breakdown for each district. In the actual election, Trump got one of the four electoral votes; he won the majority in CD2. Because there was a wide gender gap in the whole state (women voted 55 percent for Clinton and 39 percent for Trump, whereas men voted 41 percent for Clinton and 52 percent for Trump), we’re assuming that if just men had voted, Trump would have gotten majorities in both districts and would have won all four electoral votes. We’re also assuming that if just women had voted, Clinton would have gotten majorities in both districts and would have won all four electoral votes. Because white women voted 54 percent for Clinton and 39 percent for Trump, we’re assuming if just white women had voted, Clinton would have gotten all four electoral votes as well.
2012 Electoral Scenarios
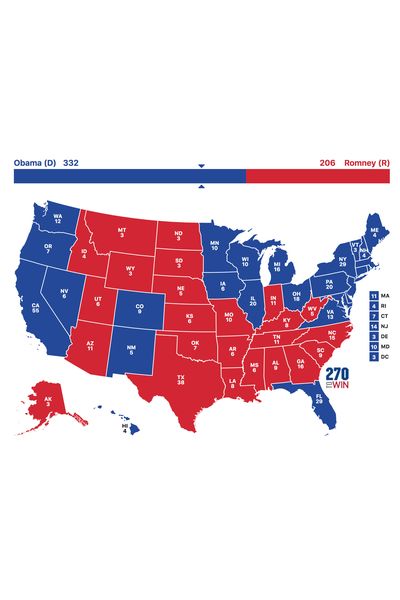
The Actual Vote
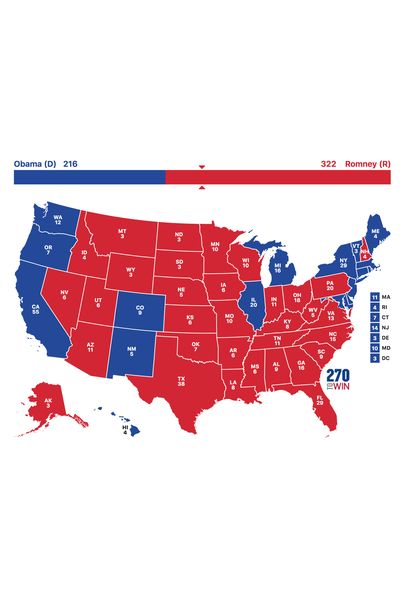
If Only Men Voted
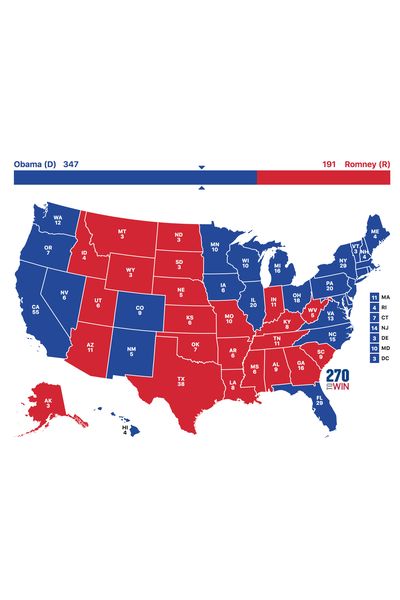
If Only Women Voted
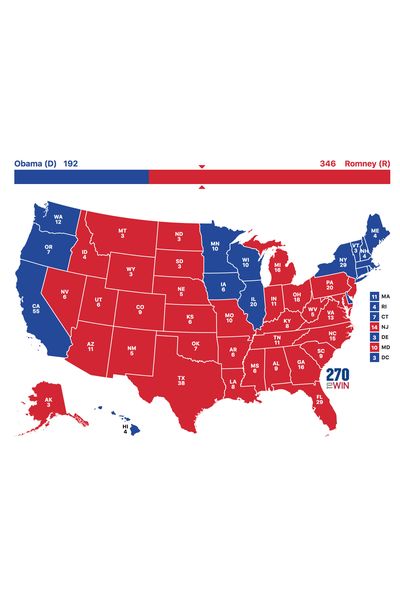
If Only White Women Voted
2012 results
For 2012, 31 states had individual statewide exit polls. There were no state-level exit polls for AK, AR, DC, DE, GA, HI, ID, KY, LA, ND, NE, OK, RI, SC, SD, TN, TX, UT, WV, and WY.
2008 Electoral Scenarios
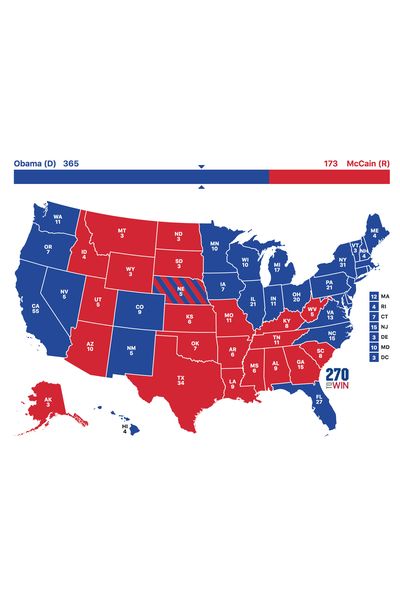
The Actual Vote
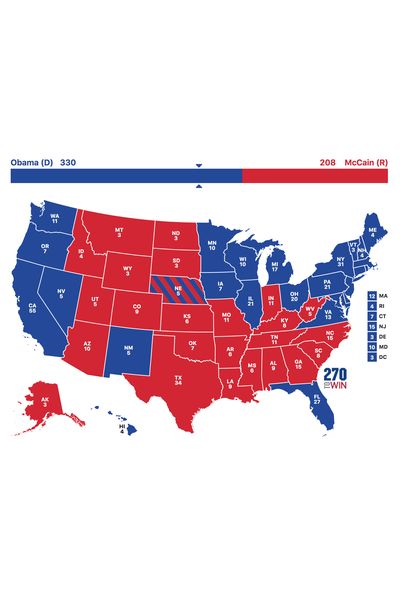
If Only Men Voted
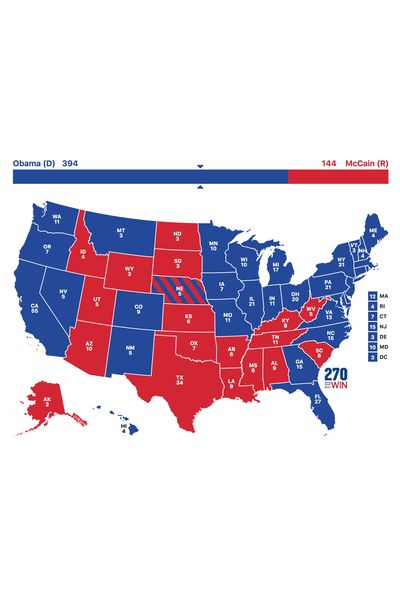
If Only Women Voted
If Only White Women Voted
2008 results
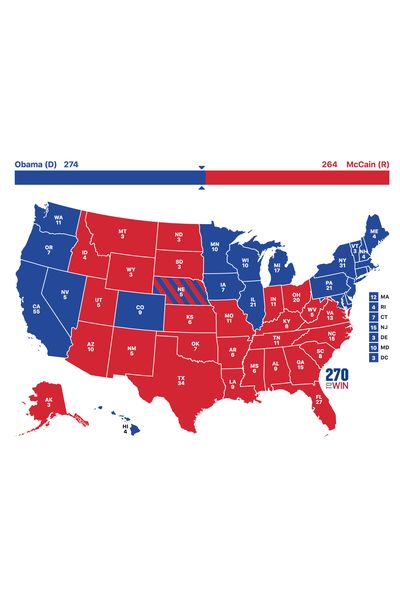
McCain won Nebraska 4–1 in reality. We kept the 4–1 score and didn’t give McCain all five votes in our counterfactual scenarios. Men voted 43 percent for Obama and 55 percent for McCain; women voted 40 percent for Obama and 58 percent for McCain; and white women voted 38 percent for Obama and 61 percent for McCain. Thus, the groups voted pretty similarly, and we don’t know the breakdown of men and women in Nebraska’s three districts. The gender gap between men and women/white women in Maine in 2016 was much bigger, and we could make educated assumptions for our counterfactual scenarios. Here, we couldn’t, so we kept the 4–1 electoral vote allotment as is.
Besides 2008 and 2016, electoral votes in Maine and Nebraska all went to one candidate, as opposed to being split, for every year. We’re assuming they wouldn’t have been split in our scenarios for these other years.
2004 Electoral Scenarios
The Actual Vote
If Only Men Voted
If Only Women Voted
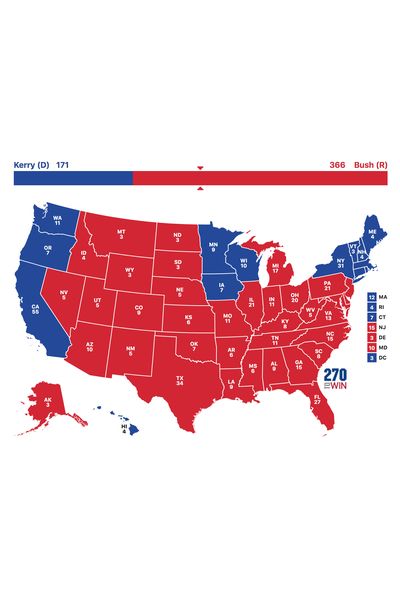
If Only White Women Voted
2004 results
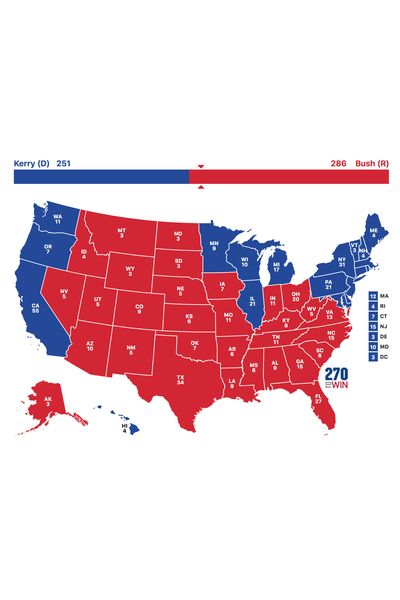
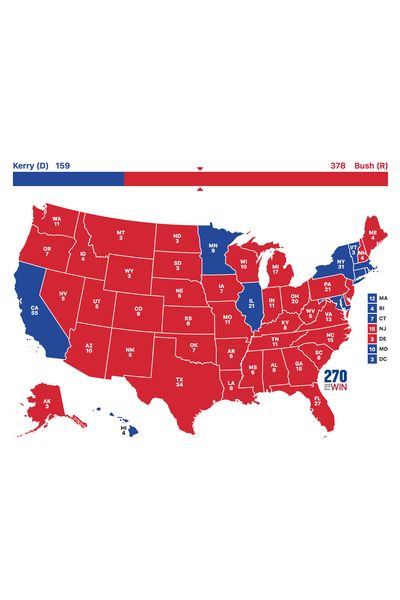
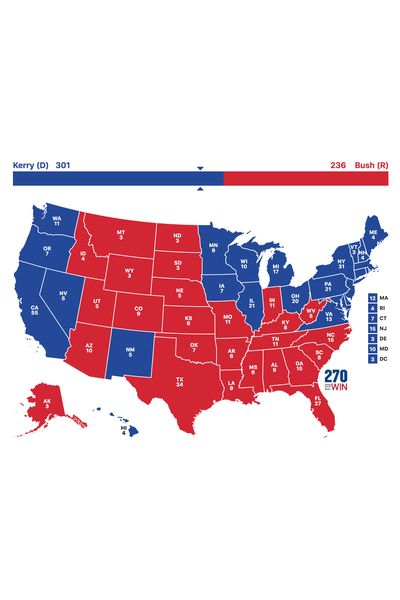
In 2004, there were 537 electoral votes between Bush and Kerry rather than 538. One “faithless elector” (the term for a member of the United States Electoral College who does not vote for the presidential candidate for whom he or she had pledged to vote) in Minnesota gave Democrat John Edwards a vote for president, and so only nine out of the state’s total 10 votes went to Kerry.
2000 Electoral Scenarios
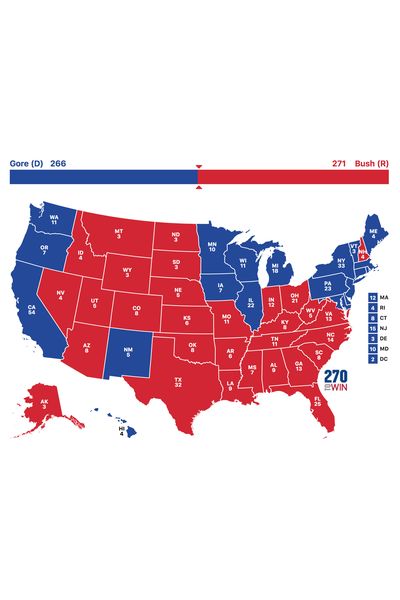
The Actual Vote
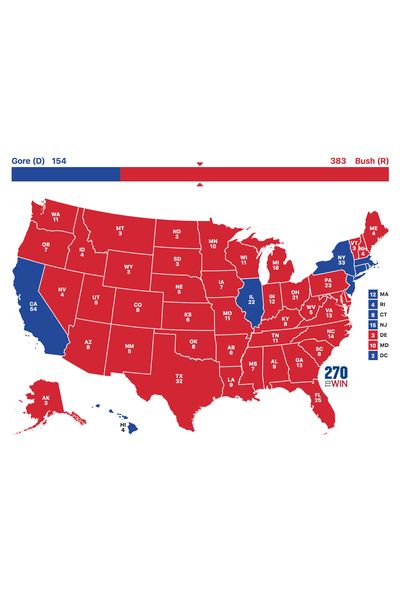
If Only Men Voted
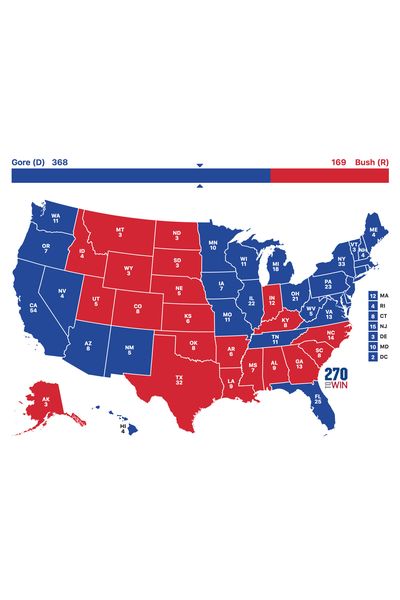
If Only Women Voted
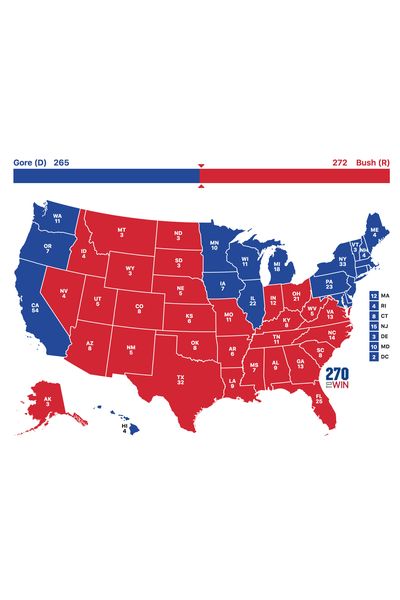
If Only White Women Voted
2000 results
In 2000, there were 537 electoral votes between Bush and Gore rather than 538. One elector from D.C. abstained, and so only two out of D.C.’s total three votes went to Gore.
1996 Electoral Scenarios
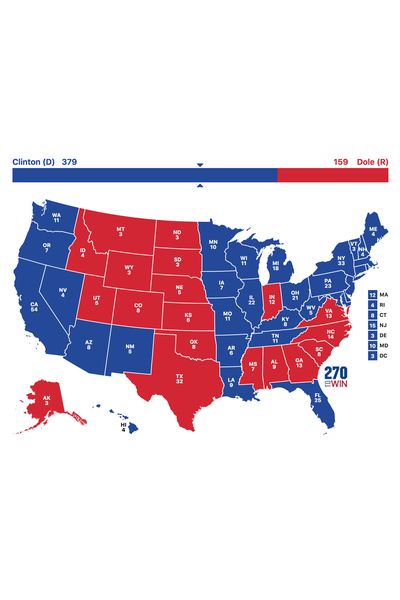
The Actual Vote
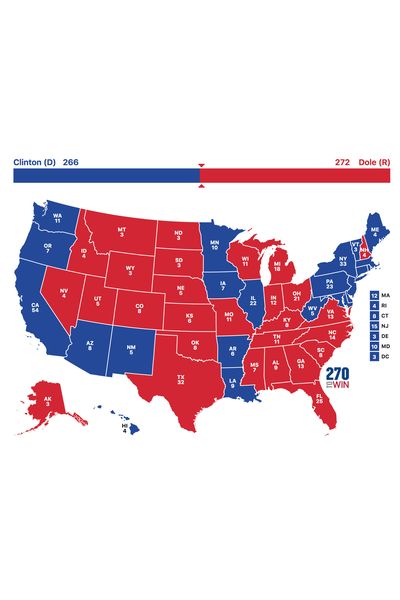
If Only Men Voted
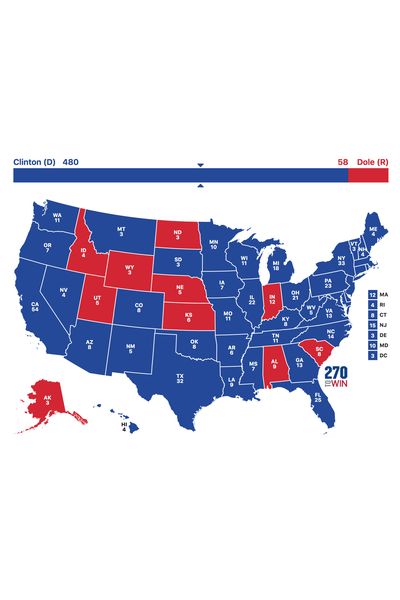
If Only Women Voted
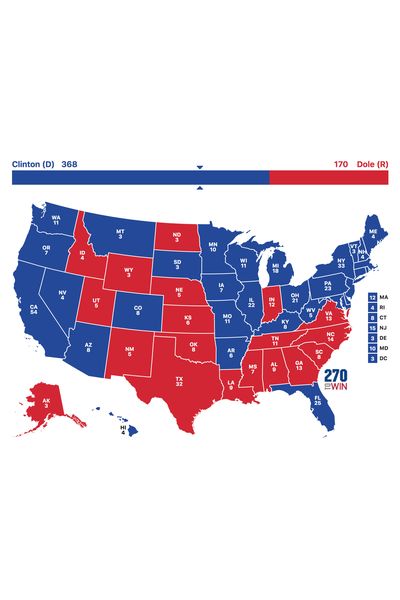
If Only White Women Voted
1996 results
See below info about tiebreakers.
1992 Electoral Scenarios
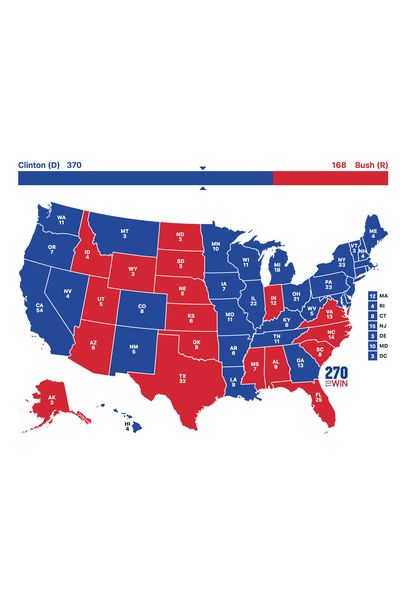
The Actual Vote
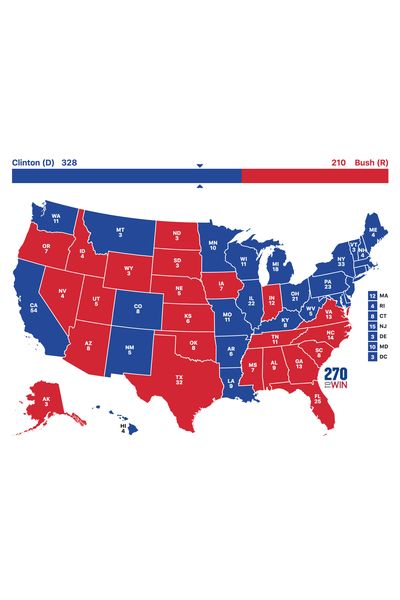
If Only Men Voted
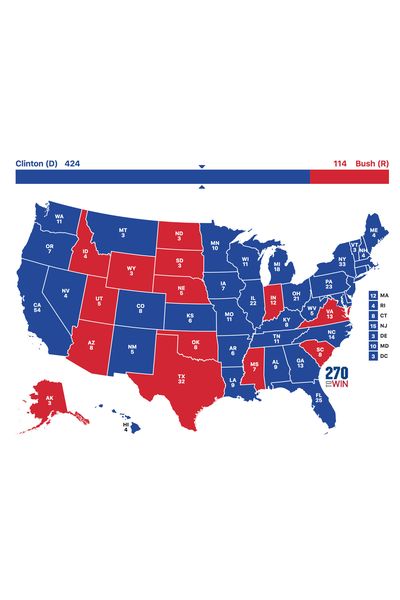
If Only Women Voted
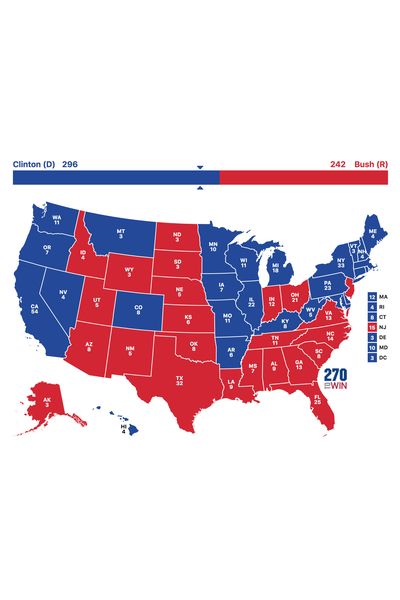
If Only White Women Voted
1992 results
See below info about tiebreakers.
1988 Electoral Scenarios
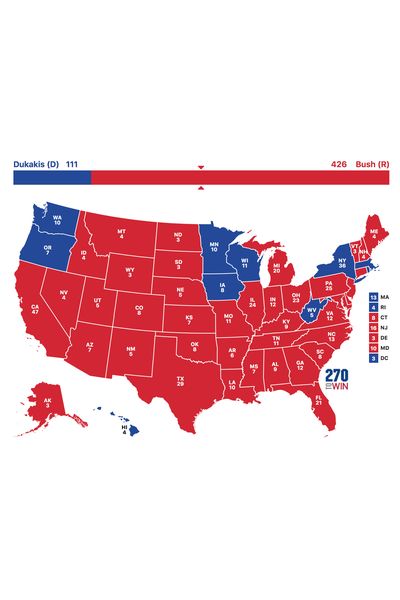
The Actual Vote
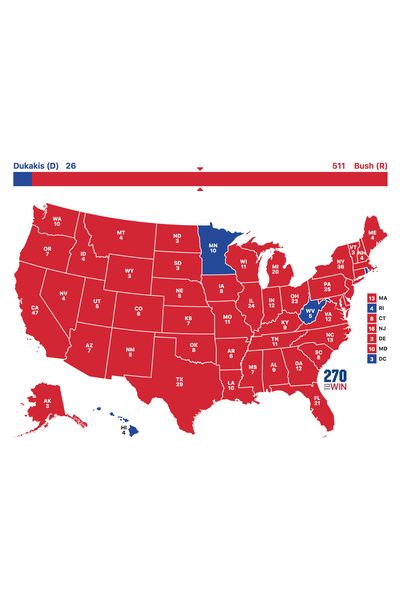
If Only Men Voted
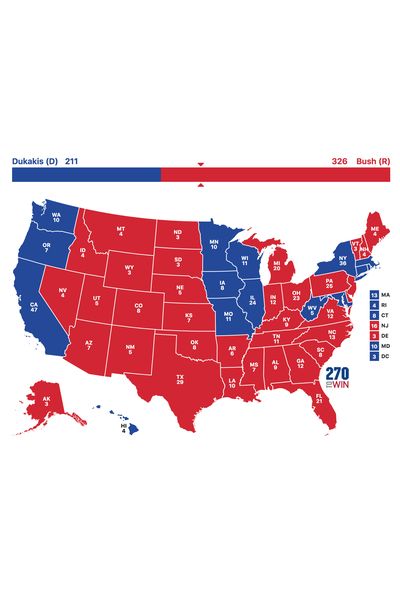
If Only Women Voted
1988 results
In 1988, there were 537 electoral votes between Bush and Dukakis instead of 538. A faithless elector in West Virginia gave a vote to Democrat Lloyd Bentsen, and so only five of the state’s six votes went to Dukakis.
For 1988, 24 states had individual statewide exit polls. There were no state-level exit polls for AK, AL, AR, AZ, CO, DC, DE, GA, HI, ID, KS, KY, LA, ME, MT, ND, NE, NH, OK, RI, SC, SD, TN, UT, VA, WV, and WY.
1984 Electoral Scenarios
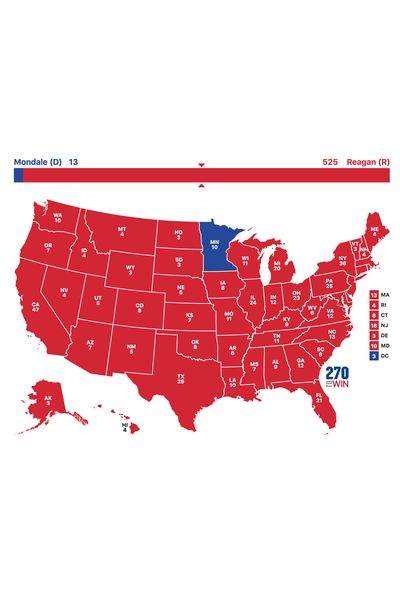
The Actual Vote
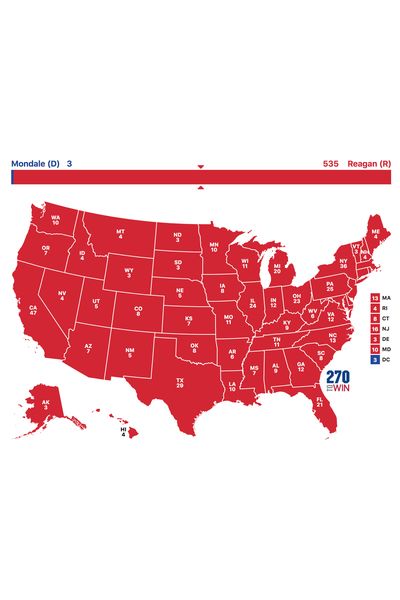
If Only Men Voted
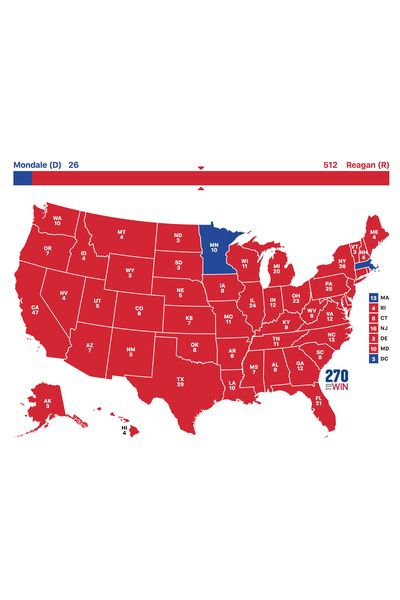
If Only Women Voted
1984 results
For 1984, 17 states had individual statewide exit polls. There were no state-level exit polls for AK, AR, AZ, CO, CT, DC, DE, FL, GA, HI, ID, IN, KS, KY, LA, MD, ME, MO, MT, ND, NE, NM, NV, OK, RI, SC, SD, TN, UT, VA, VT, WA, WI, and WY.
Breaking ties
PhD student Nina Obermeier, who is affiliated with Roper, ran the raw exit-poll data for us to break exit-poll “ties” at the whole-number level. In certain cases, she ran the data to the hundredth place and still couldn’t break the tie. These are those ties:
2000 white-women-only scenario, West Virginia, and women-only, Arkansas: Because both states went to Bush in reality, we kept the votes as going to Bush in these scenarios.
1996 men-only scenario, New Mexico: Because the state went to Clinton in reality, we marked New Mexico as going to Clinton. (This didn’t keep Dole from winning the overall election in our counterfactual scenario.)
1992 men-only scenario, South Dakota: If more men had voted for Clinton than Bush, this would have been the only instance out of every individual statewide exit poll in which a state would have flipped Democrat from Republican if only men had voted. (For comparison, over this same time period, 62 states would have turned Democrat to Republican if only men had voted). Because South Dakota actually went to Bush, we counted it as going to Bush when calculating the electoral votes in the men-only scenario.
1992 white-women-only scenario, Kansas: Because Bush won the state, we counted Kansas as going to Bush.
Dedicated to women of power, purpose, and style, Marie Claire is committed to celebrating the richness and scope of women's lives. Reaching millions of women every month, Marie Claire is an internationally recognized destination for celebrity news, fashion trends, beauty recommendations, and renowned investigative packages.